One of the most heralded personal investment books of the past few years is The Ivy Portfolio, by Mebane Faber and Eric Richardson. In addition to writing about how successful university endowments manage their portfolios, the authors describe a tactical asset allocation model that’s uncomplicated enough for individual investors to follow.
The rule is simply to invest in the asset when its most recent month-end value is above its trailing 200-day simple moving average, otherwise hold cash. (200 trading days is nearly equal to 10 calendar months). It’s easy enough to verify how well following this rule would have worked with the S&P 500 or any of its indexed ETFs or mutual funds. During periods when the index has been below the threshold, returns have been volatile and poor, otherwise they have generally been attractive.
Did SMA Disciples Contribute to Recent Market Volatility?
Depending on how you measure it, the S&P 500 finished July either just above or just below its 200-day SMA, but it has dipped below since then. Whether an individual following this discipline might have sold depends on how frequently the investor is measuring the SMA (daily or month-end measures?), whether the investor is using the index itself or an indexed ETF or mutual fund, whether the investor is using unadjusted or adjusted prices, and most importantly, whether the investor permits himself to rebalance intra-month.
The Systematic Risk Danger
The growing popularity of this rule ought to concern anyone concerned with systematic risk. What is apparently a wealth preservation tool to individual investors serves as a positive feedback loop to the market. Almost any rule you follow is fine until enough other participants are doing it too. How much of the past week’s fluctuations were due to disagreement about whether the level was above or below threshold? We’ll never know, but if enough market participants abide by the rule it could become destabilizing, just as synthetic portfolio insurance became in 1987. Selling begets more selling, etc.
The Individual Risk
There is more that ought to concern individual investors who follow it. The rule is popular because it’s easy to follow and appears to have worked within a handful of investments as described by the authors, but there’s no law of nature to explain why it should continue to work. It approximates a momentum investing rule, and momentum’s virtues are well documented, but whether 200-days or some other window will reign in the future is unknown. To the extent a 10-month moving average approximates speculators’ threshold for holding a risky asset, it’s fine, but its increased popularity has made it more of a self-fulfilling prophecy. Speculators, aware that so many follow this rule, might adapt to shorter and shorter time horizons, anticipating investors flipping risk on and off; their shorter time horizons could lead to shorter windows working better in the future. In short, the SMA rule that works best in the future could be quite different.
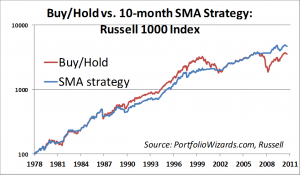
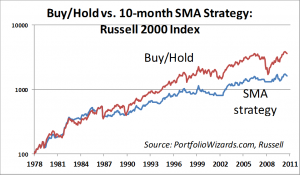
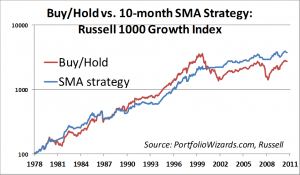
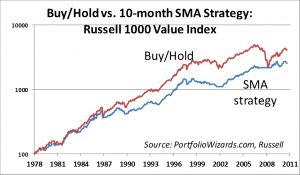
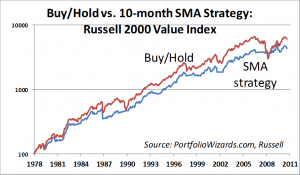
Further, applying it to the wrong assets can lead to worse performance than buy-and-hold. A case in point is the Russell indices. Russell reconstitutes its indexes annually, near the end of June. That means any index SMA you measure, except in May and June, probably reflects a significantly different set of stocks at the beginning of your moving average window from the set at the end. You can think of Russell’s reconstitution as resetting your SMA clock. Or you can think of it as an automatic outsource – Russell, in effect, shuffles winners and losers so you don’t have to, sparing you of the transaction costs.
In the charts below, the Buy/Hold strategy is in Red, the SMA strategy is in Blue.
I assumed cash earned the 3-month T-bill rate, but I also assumed zero transaction costs. While the Russell 1000 and Russell 1000 Growth showed some return advantages assuming you could trade for free, none of the other indexes invite you to apply this approach. If you couldn’t trade for free, there’s little compelling evidence here that suggests the rule would have helped anybody but your broker sleep better at night.
Conclusion: Instead of Going to Cash, Change Your Volatility Assumptions
This post is not meant to caution you to ignore the SMA rule, it’s meant to caution you to understand it. Blindly following a rule isn’t a discipline; it’s superstition.
Instead of treating this as a binary Risk On/Risk Off decision, why not use a more rigorous approach? Consider treating being above or below a 10-month SMA as a regime definition. Above the SMA is less volatile, below the SMA is more volatile. Inspecting the S&P 500 daily returns, I’ve found the series above the SMA to exhibit half the volatility as below the SMA. Plug the revised assumptions into any risk-based optimization and your optimal allocation to the asset in question will decline, without any views on returns. At the very least you’ll save money on transaction costs at times when they’re likely to be quite high.

Comments
2 responses to “The individual risk and systematic danger of following the 200-day SMA rule”
Very interesting piece Tom. Does the conclusion or the results change much if you use a daily or weekly snapshot to make the asset allocation decision? Also, I think you were focused upon the overall returns, but it certainly looked like the SMA approach had a lower overall volatility, so you’re risk adjusted return may be better with that approach, no? Thanks!
Shagg, right on both. Results change if you define your Moving Average using daily, weekly, or monthly figures. It can also change if you use a daily Moving Average but decide weekly or monthly. For this set of examples I happened to have monthly data on the Russell Indices back to year-end 1978, so that’s what I used.
You’re correct about risk-adjusted returns: the SMA series clearly have lower volatility, so their risk-adjusted returns are likely higher in all instances.
Like I wrote, the purpose of this post is to encourage people not to ignore the SMA strategy but to understand it better. Thanks for helping!