This Excel workbook illustrates how to find a Risk Parity allocation in Excel, using Solver. It uses no macros or VBA, but it requires you to enable Solver.
RiskParityDemo_3Assets (Excel 97-03)
This link downloads an Excel 1997-2003 workbook. To see it work, you have to open the file in Excel and enable Solver.
RiskParityDemo_3Assets (Excel 2010)
This link downloads an Excel 2010 workbook. To see it work, you have to open the file in Excel and enable Solver.
The workbooks are the same, except the 2010 version consumes less file space. They contain four sheets: Instructions, Inputs, Calculations, Results. I suggest you read Instructions first.
NB: I made up the covariances in these workbooks for the purpose of demonstrating how to use Solver to find risk parity weights. I intend for the numbers to serve as placeholders for your own assumptions. Do not rely on the numbers provided.
Inputs
On the Inputs sheet, you’ll find a list of 3 assets, along with numbers for Volatility and Correlation Coefficients to illustrate how Risk Parity works. Change the Asset Names, Volatilities, and lower triangle of Correlations on this sheet if you like.

Calculations
The Calculations sheet converts the Volatilities and Correlations into a Covariance matrix. The set-up assumes the Volatilities are Standard Deviations, not Variance or some other measure.
Results
The Results sheet allows you to start with different weights; the workbook calculates all other fields. On the Results sheet, open the Solver dialog box and hit “Solve.”
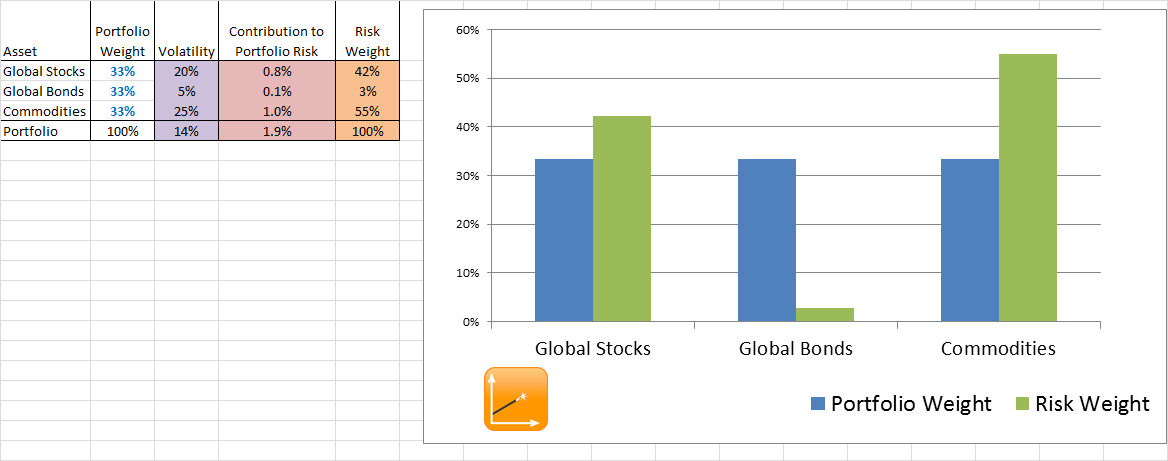
Solver finds the allocation for which the assets’ contribution to portfolio risk are equal. Here’s the “Before” information on portfolio weights vs. risk weights.
“Before”

“After”
Here’s the “After” information on portfolio weights vs. risk weights.

These workbooks are for illustration purposes only.