Institutional investors have long been indoctrinated with the notions of stocks for the long run and the importance of remaining fully invested. As I touched on stocks for the long run in an earlier post, in this one I will address remaining fully invested.
The argument in favor of remaining fully invested went like this: “If you would have missed only the X highest returning days in history, your annualized total return would have fallen from Y to Z.” Fill in the blanks with the appropriate digits, and the point is pretty clear.
For example, if you would have bought the SPDR (SPY) at its inception, your annualized total return through November 2011 would have been 7.89%. If you could have missed only the best day over that span, Oct. 13 2008, your return would have fallen to 6.82%, over a 1 percentage point drop. Missed the second best day too (Oct. 28, 2008)? Sorry, your return fell to only 6.19%.
| Date | SPY 1-day Return | Annualized Return if Missed |
|---|---|---|
| 10/13/2008 | 14.53% | 6.82% |
| 10/28/2008 | 11.68% | 6.19% |
| 3/23/2009 | 7.18% | 5.80% |
| 11/24/2008 | 6.94% | 5.43% |
| 11/13/2008 | 6.24% | 5.10% |
Source: PortfolioWizards
What the “Remain Fully Invested” Argument Typically Leaves Out
If you have a short memory, you might suspect October and November 2008 must have been a great couple of months. In fact, October was the worst month over that span, returning -16.52%, and November was 14th worst. They did rank #1 and #2 in daily volatility, however.
What the “remain fully invested” proponents typically don’t disclose is that the market’s greatest days often occur among its worst. Much as you’d rather not miss out on the best days, given the choice you’d be better off missing both.
Instead of Trying to Time Returns, Try to Identify Shifting Periods of Volatility
While timing market returns is difficult if not impossible, anticipating escalating volatility and reducing your allocation is within the grasp of most sophisticated investors.
Source: PortfolioWizards
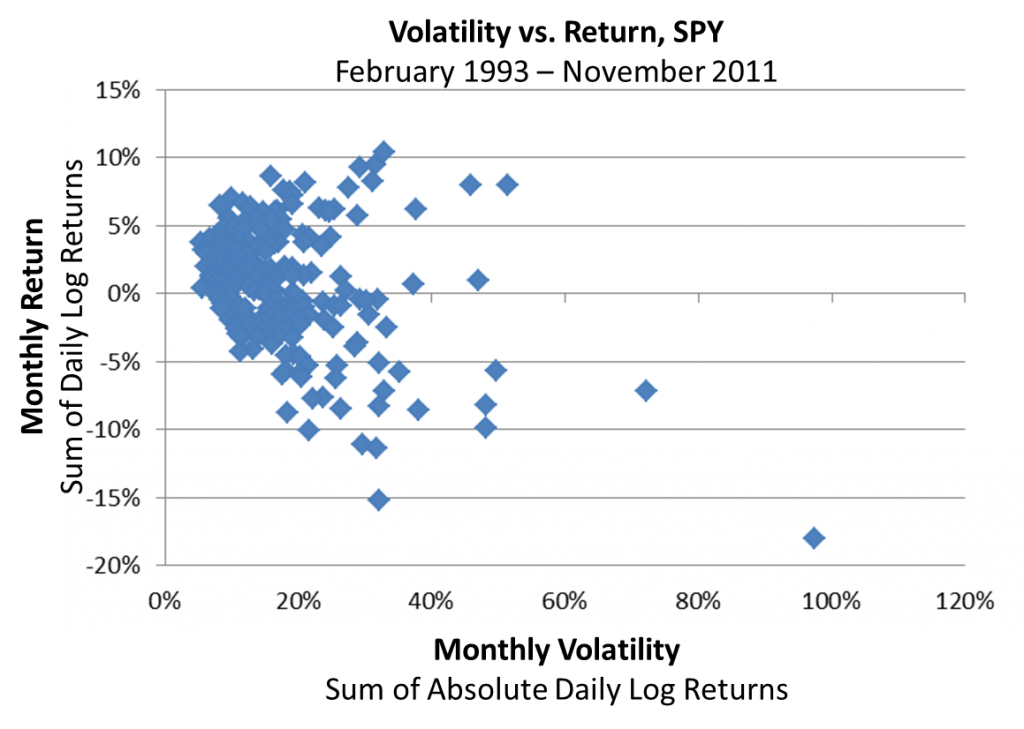
The chart above depicts monthly log returns since inception for SPY versus the within-month daily volatility, estimated as the sum of absolute log returns. While observations grow sparse the farther to the right you look, it suggests that simply avoiding the most volatile months might be a more fruitful goal than identifying the best ones.
Source: PortfolioWizards
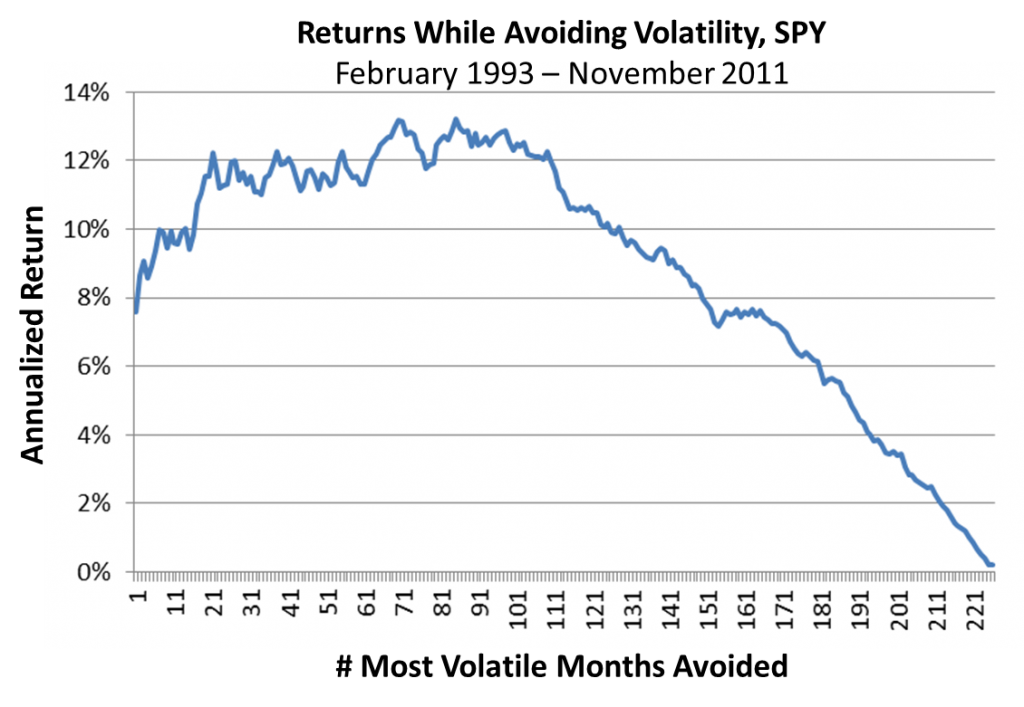
The chart above suggests the sweet spot for avoiding the most volatile months would have been somewhere around 70, or about 1/3 of the months since SPY’s inception. Of course that would have entailed missing out on some great returning months, and managing client expectations while sitting on the sidelines during a market rebound is challenging.
While none have the perfect hindsight available in the second chart, simple volatility regime-switching indicators are available online every day, free of charge. All a savvy investor has to do is develop some effective decision rules for downshifting risk allocations at appropriate times.
Disclsoure: I hold no SPY, and have no plans to transact in SPY this week.
Past performance does not predict future performance.

