Dynamic Trading Rules: Change the Time Window and a Different Picture Emerges
Further examining a 200-day Moving Average (200MA) strategy for mitigating downside risk, I was recently examining how the picture changes when you alter the time window for assessing these strategies.
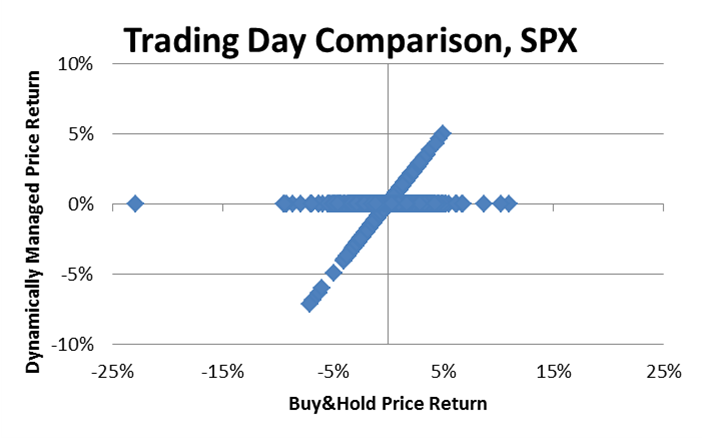
Below is a scatterplot of a dynamically managed strategy using 200MA (vertical axis) versus Buy & Hold (horizontal axis). It excludes assumptions about transaction costs, slippage, and interest on cash.
 One day price returns, S&P 500 Stock Index, October 19, 1950 – December 16, 2011
Source: PortfolioWizards, Yahoo! Finance
Past performance does not predict future performance
The plot above doesn’t tell you much, because you basically see a diagonal line when the 200MA is invested and a horizontal line when it’s not.
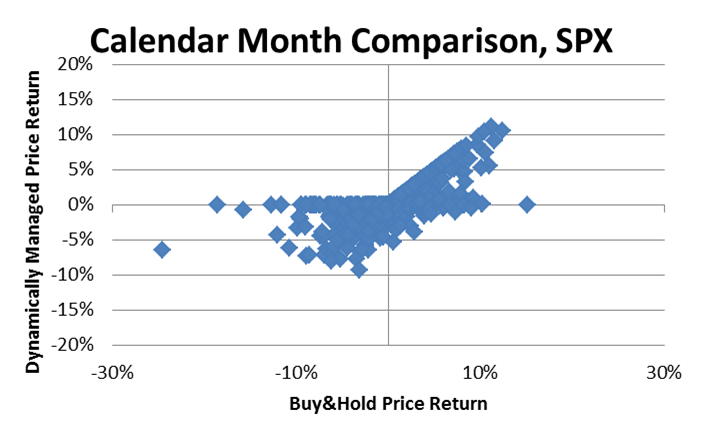
Group these trading days into proper calendar months, and the picture shifts a bit.
 One month price returns, S&P 500 Stock Index, November, 1950 – November, 2011
Source: PortfolioWizards, Yahoo! Finance
Past performance does not predict future performance
Now we’re starting to see something vaguely resembling the payoff diagram of an at-the-money call option, but not quite. The one thing that’s clear: this scatterplot has an unequivocal lack of observations in the upper left quadrant, meaning if there’s a return advantage at all it DOESN’T come from positive returns while the market is down; it would have to come from compounding zero or small negative returns when the market is down a lot more.
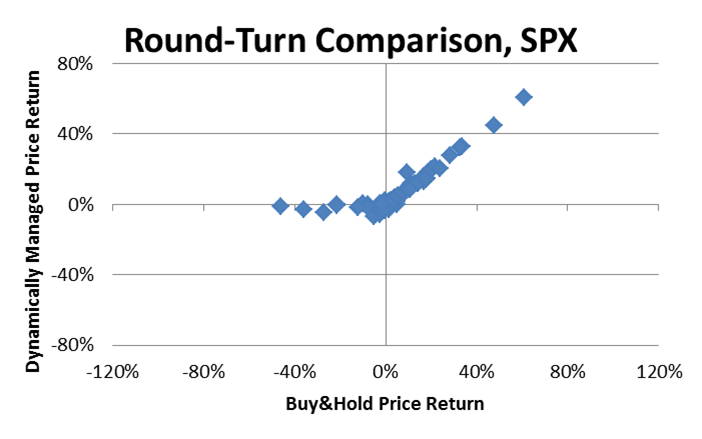
What if we freed ourselves from examining calendar-based time windows? What if we just looked at “round-turns,” where a “round-turn” is measured over a full cycle of being fully invested and fully uninvested, regardless of how long or short those cycles might be?
When we do this, the picture clarifies.
 Round-turn price returns, S&P 500 Stock Index, October 19, 1950 – December 16, 2011
Source: PortfolioWizards, Yahoo! Finance
Past performance does not predict future performance
This picture is remarkably similar to that of an at-the-money call option. It would appear that the way an effective volatility management strategy depending on 200MA works is it allows you to participate in protracted positive runs and limits your participation in protracted negative runs.
What are the risks?
Several:
- transaction costs might be considerable
- round-turns could be as short as two trading days or as long as several calendar years
- total returns would be different, as these plots ignore the positive returns due to dividend income
- this strategy is vulnerable to price jumps in both directions – it offers no protection for abrupt price drops in tame market environments, and won’t participate in rebounds after protracted market declines
- this discussion is silent on how to implement this information in your asset allocation process, or whether you even should do it at all