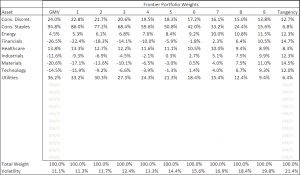
This Excel workbook illustrates how to use Excel’s matrix functions to find unconstrained frontier portfolios, from a global minimum variance portfolio up to a tangency portfolio. It uses no macros or VBA, nor does it require you to enable Solver.
Efficient_Frontier_Portfolios (Excel 2010)
(Version 3 corrects the volatility estimate for FrontierPort4.)
The workbook is “flexible” in that it accommodates any number of assets up to 50. It is simple to use.
Disclaimer
This workbook and the results it produces do not constitute investment advice.
The workbook and its contents serve to illustrate how to generate an efficient frontier without any return assumptions. While that topic may be of interest to students or instructors of finance, it does not pertain to investment choices made by most people. If you are not well-versed in the mathematics of modern portfolio theory (MPT) or the Capital Asset Pricing Model (CAPM), and you think you understand this workbook, you are probably mistaken.
The frontier generated spans the GMV portfolio (using simple matrix math) and the tangency portfolio (applying CAPM assumptions and the assumption that the risk-free rate is zero). Points between are fractionally equidistant in weight.
You should not use this workbook to make investment decisions.
1. Enter the names, volatilities, and correlations on the DataEntry sheet.
The sheet is populated with 9 assets’ data in rows 2 – 10. To add more assets, simply type in their data in rows 11 and below. To examine more or fewer than 9, delete data in the rows you don’t need or add data in the rows you do need, and write the number of assets in cell A2
2. See the resulting frontier portfolios on the Frontier sheet.
If you have no stray data in the DataEntry sheet, the Frontier sheet displays allocations from Global Minimum Variance (GMV) in Column B to Tangency in Column L. In the 9-sector example, notice how the allocations migrate from a long-short GMV portfolio to a long-only Tangency portfolio, in which reward/risk is maximized. In a world with a zero risk-free rate, the Tangency portfolio should be the market portfolio, assuming all assets are represented. It is interesting to note that the weights of the Tangency portfolio are a respectably close approximation of the actual sector weights in the S&P 500, when the data for this workbook were estimated.
Regardless of whether you believe in CAPM, you have to admit that the math is elegant – which is probably a significant reason so many still cling to CAPM.

